> ## Documentation Index
> Fetch the complete documentation index at: https://help.ciclostrategy.com/llms.txt
> Use this file to discover all available pages before exploring further.
# Performance & KPIs
> Turn strategic goals into measurable KPIs, record progress over time, and see how you're tracking at a glance.
## Overview
The Performance page is where you track and manage your team's KPIs. Each KPI appears as a
tile showing current progress toward its target, with a detailed history a click away.
Well-designed KPIs translate your strategic goals into measurable outcomes — so you always
know whether you're moving in the right direction.
 ## Create a KPI
Pick your team, then choose **Performance** in the sidebar.
Create a **New KPI** and fill out its details:
* **Name** — clear and specific (e.g. "Compliance Issues Resolved").
* **Icon** — a quick visual cue for the metric.
* **Unit** — what you're measuring (issues, dollars, %, widgets…).
* **Target value** — the goal you want to reach.
* **Starting value** — where you are now.
* **Comment** — any context worth recording.
## Create a KPI
Pick your team, then choose **Performance** in the sidebar.
Create a **New KPI** and fill out its details:
* **Name** — clear and specific (e.g. "Compliance Issues Resolved").
* **Icon** — a quick visual cue for the metric.
* **Unit** — what you're measuring (issues, dollars, %, widgets…).
* **Target value** — the goal you want to reach.
* **Starting value** — where you are now.
* **Comment** — any context worth recording.
 Pick how success is measured:
* **Higher is better** — increase a number (sales, satisfaction).
* **Lower is better** — decrease a number (costs, errors, response time).
* **Achieved or not** — a binary outcome (e.g. "New office opened").
Pick how success is measured:
* **Higher is better** — increase a number (sales, satisfaction).
* **Lower is better** — decrease a number (costs, errors, response time).
* **Achieved or not** — a binary outcome (e.g. "New office opened").
 The KPI appears as a tile with a progress meter. For example, 4 of 20 issues resolved
shows 20% progress.
## Track progress over time
Open the tile's three-dot menu and choose **Record KPI Value**. Enter the current
value, an optional comment, and the date it was achieved.
The KPI appears as a tile with a progress meter. For example, 4 of 20 issues resolved
shows 20% progress.
## Track progress over time
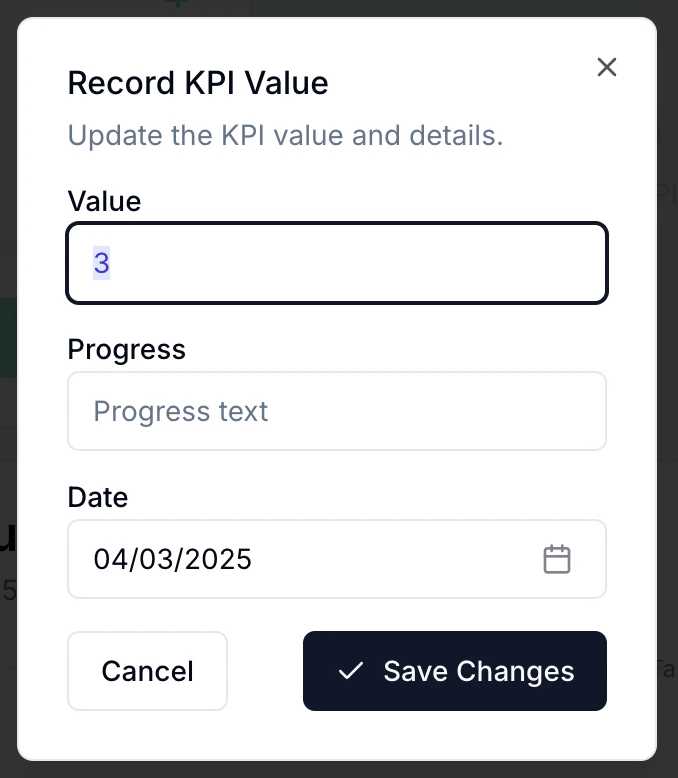
Open the tile's three-dot menu and choose **Record KPI Value**. Enter the current
value, an optional comment, and the date it was achieved.
 Click **Detail** on a tile to see how the value has changed over time. Use the time
selector (1, 3, or 12 months) to focus on short-term progress or long-term trends.
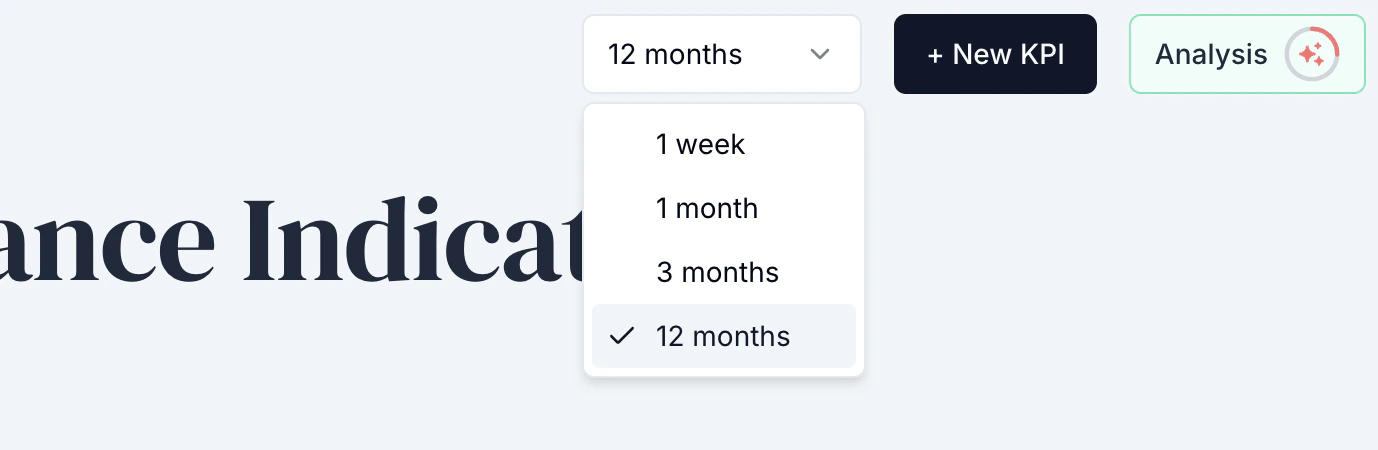
Click **Detail** on a tile to see how the value has changed over time. Use the time
selector (1, 3, or 12 months) to focus on short-term progress or long-term trends.

 Add a comment whenever you record a value to explain significant changes — your future
self and your team will thank you.
## Connect KPIs to the bigger picture
KPIs are most powerful when they clearly connect to your strategy:
* **Strategic goals → KPIs** — each KPI measures progress toward a goal.
* **Initiatives → KPIs** — roadmap [initiatives](/features/roadmap) drive KPI improvement.
* **Actions → KPIs** — link day-to-day [actions](/features/actions) to the KPIs they impact for an OKR-style approach.
KPIs from your Performance page appear automatically on the
[Strategy page](/features/strategy). Use **Import** to display a KPI from another team for
cross-functional visibility.
Add a comment whenever you record a value to explain significant changes — your future
self and your team will thank you.
## Connect KPIs to the bigger picture
KPIs are most powerful when they clearly connect to your strategy:
* **Strategic goals → KPIs** — each KPI measures progress toward a goal.
* **Initiatives → KPIs** — roadmap [initiatives](/features/roadmap) drive KPI improvement.
* **Actions → KPIs** — link day-to-day [actions](/features/actions) to the KPIs they impact for an OKR-style approach.
KPIs from your Performance page appear automatically on the
[Strategy page](/features/strategy). Use **Import** to display a KPI from another team for
cross-functional visibility.
 ## Best practices
* **Keep it key** — track a manageable number of truly important indicators.
* **Be specific** — define each KPI so there's no ambiguity about what's measured.
* **Set realistic targets** — ambitious but achievable in the timeframe.
* **Update on a cadence** — a consistent rhythm keeps the picture accurate.
## Related
## Best practices
* **Keep it key** — track a manageable number of truly important indicators.
* **Be specific** — define each KPI so there's no ambiguity about what's measured.
* **Set realistic targets** — ambitious but achievable in the timeframe.
* **Update on a cadence** — a consistent rhythm keeps the picture accurate.
## Related