> ## Documentation Index
> Fetch the complete documentation index at: https://help.ciclostrategy.com/llms.txt
> Use this file to discover all available pages before exploring further.
# Reports & sharing
> Generate AI-written reports that summarise progress across your organisation, then edit, schedule, and share them with stakeholders.
## Overview
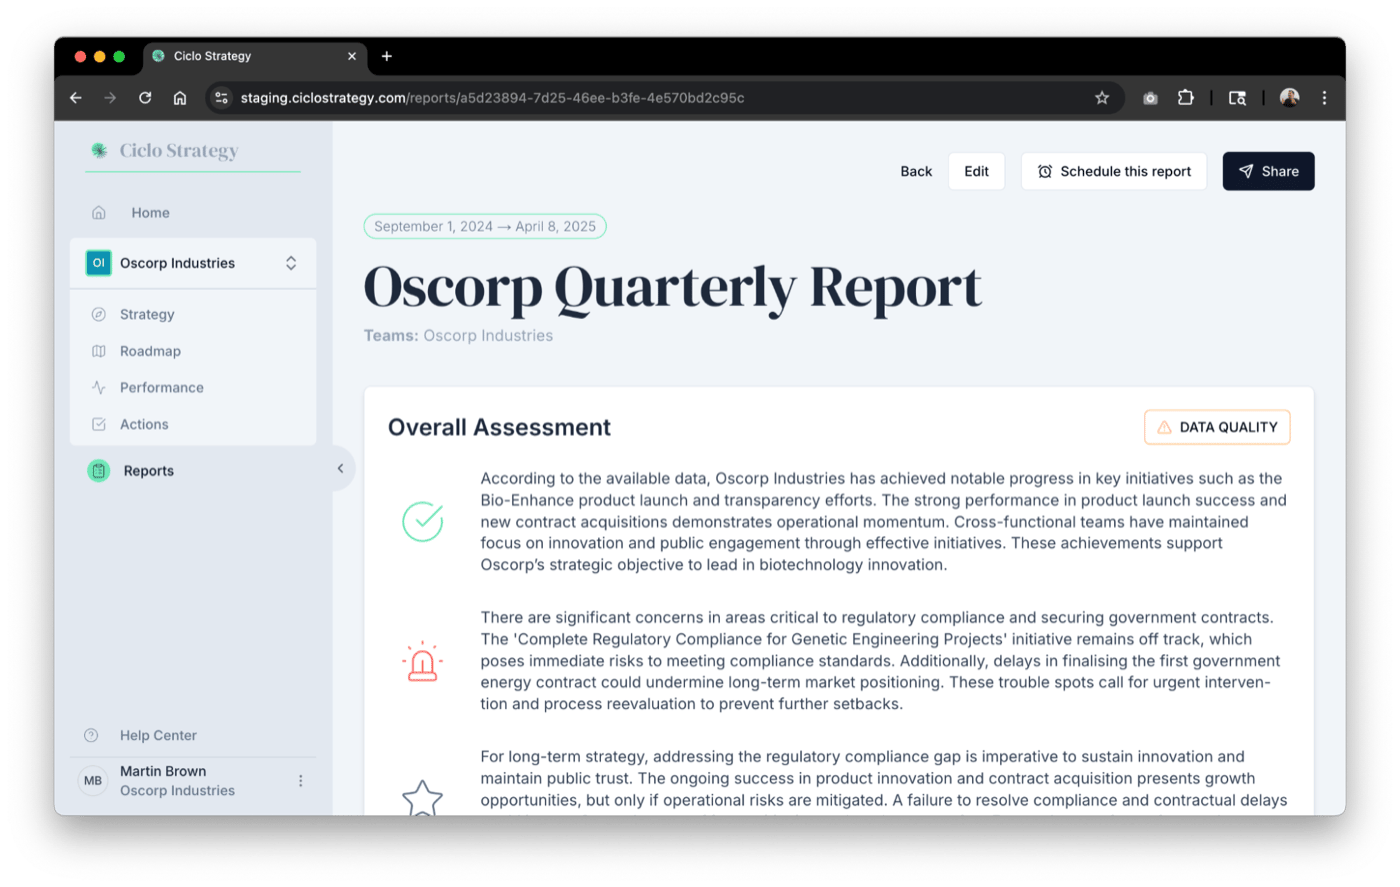
The Reports page is where you create and manage **AI-generated reports** that summarise
progress across your organisation — strategic goal alignment, initiative progress, KPI
performance, and other key insights, synthesised into a shareable narrative. Use them to
understand what's working, prioritise effort, audit data quality, and align teams.
 ## Create a report
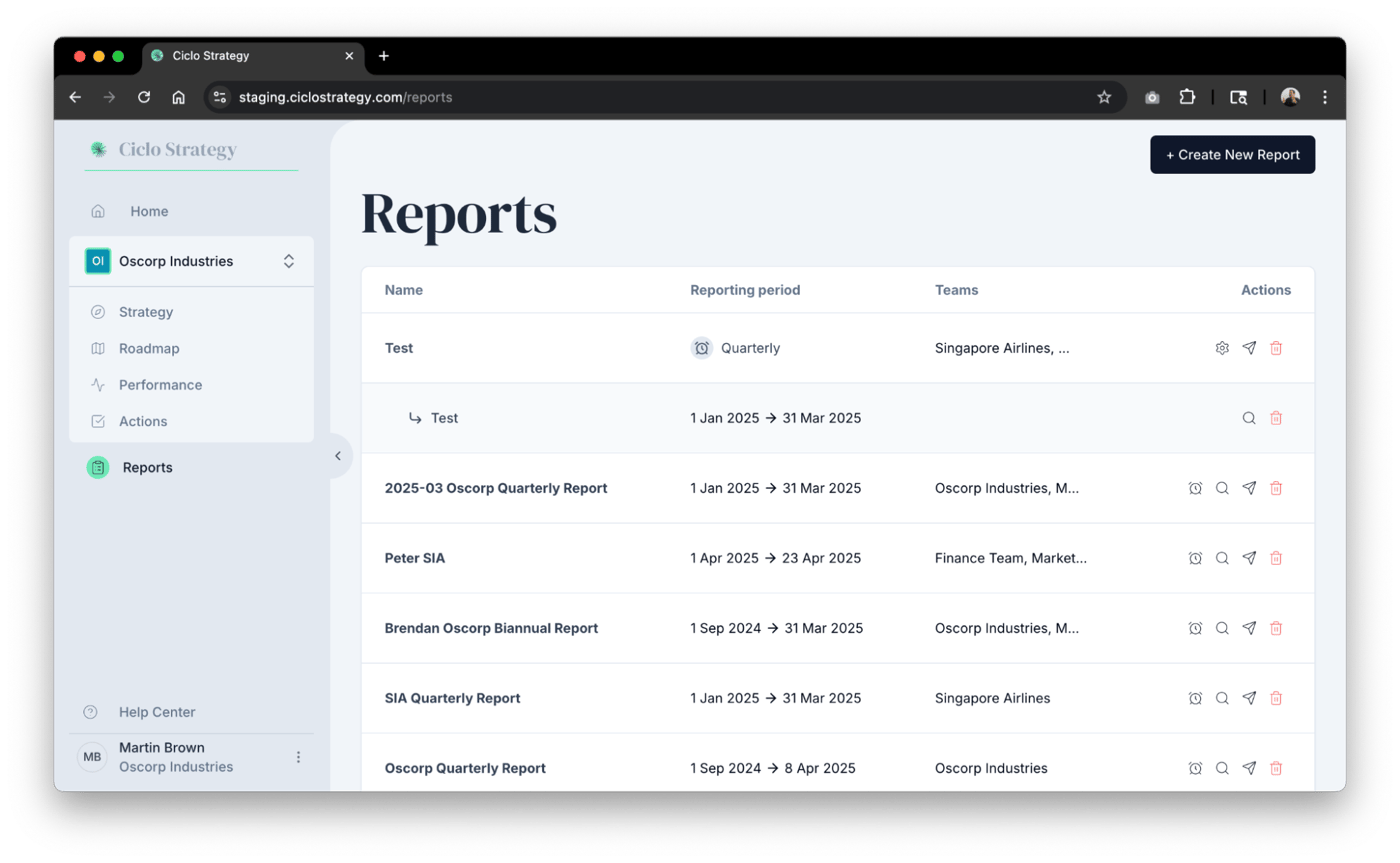
Choose **Reports** in the sidebar, then **Create New Report**. (The first time, the
page will be empty.)
## Create a report
Choose **Reports** in the sidebar, then **Create New Report**. (The first time, the
page will be empty.)
 In the dialog:
* **Title** — a clear, recognisable name.
* **Questions to include** — toggle prompts like *What is progressing well?*, *Where
are my trouble spots?*, *What's impacting my strategic goals?*, *Are my KPIs tracking
to target?*
* **Custom query** — ask a strategic question, e.g. "What is the one project I should
prioritise above all else?"
* **Teams** — all teams (default) or specific ones.
* **Additional data** (optional) — upload supporting files (financial spreadsheets,
KPI trackers, status updates, meeting transcripts) to enrich the analysis; documents
are deleted once processed.
* **Reporting period** — previous week, month, quarter (the default), or year; current
month, quarter, or year; or a custom date range.
These options shape what the AI analyses, tailoring the report to your questions, data
scope, and audience.
Generation takes a minute or two — you can work elsewhere in the platform while it runs.
## Review the completed report
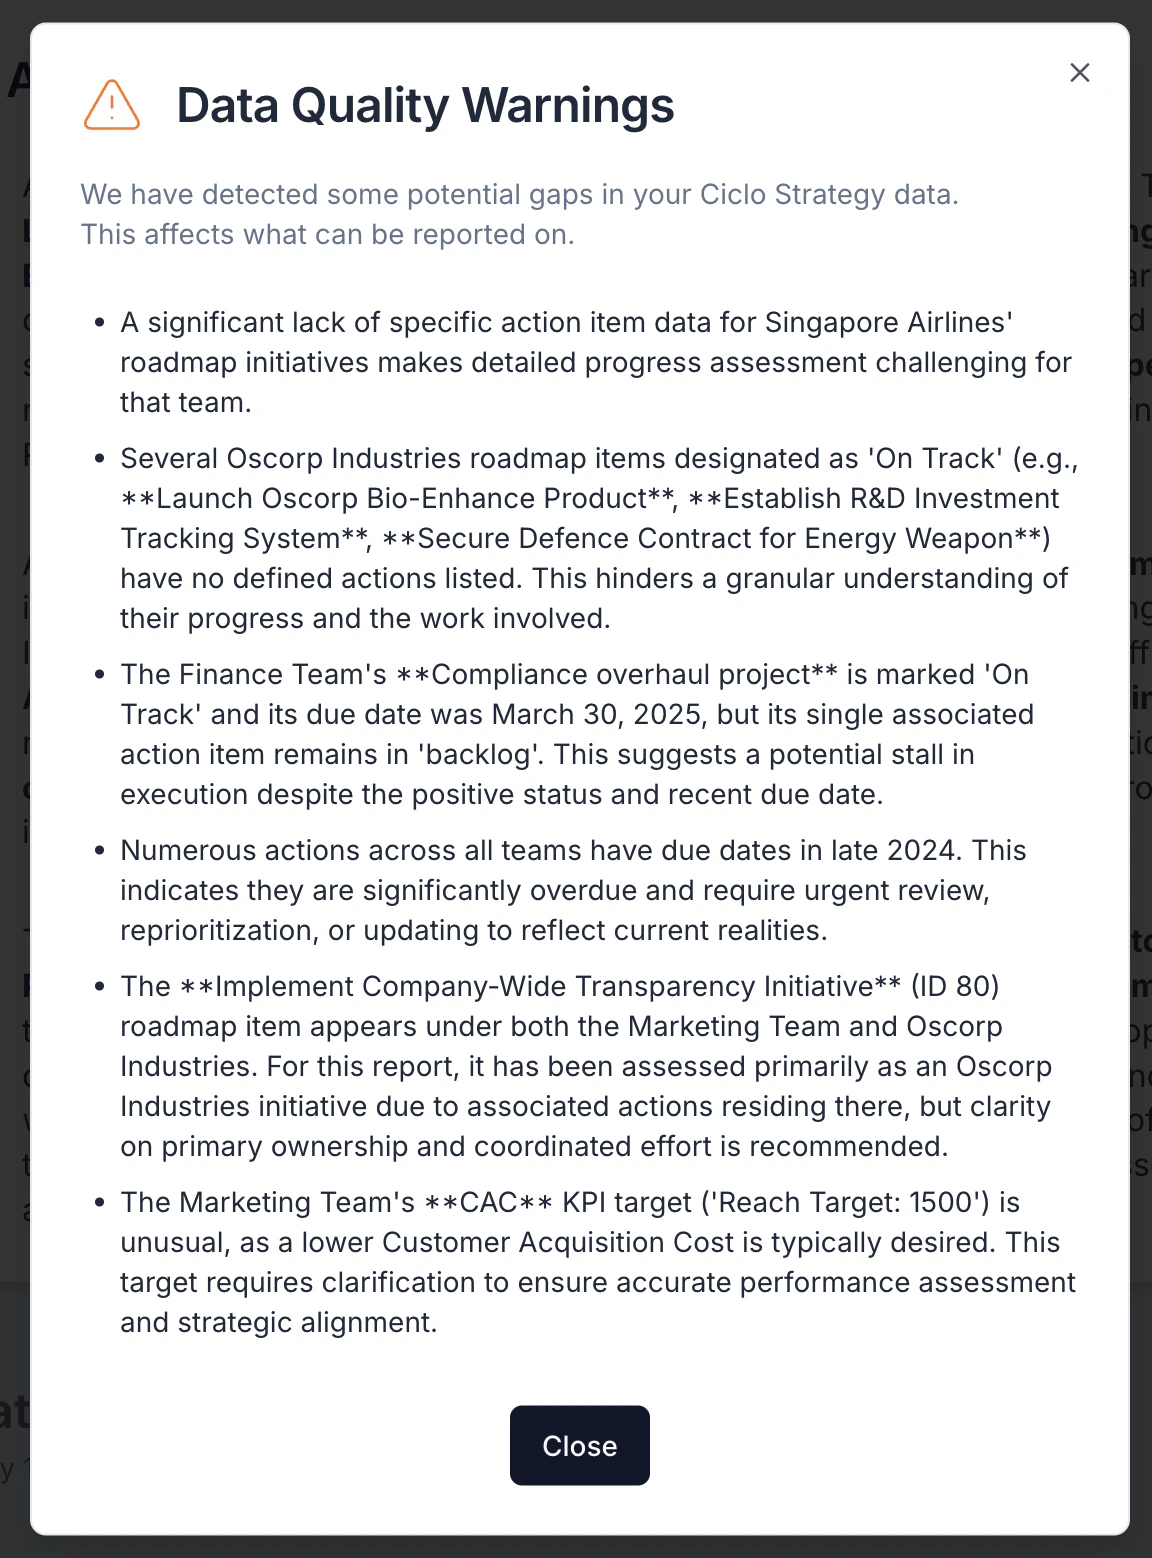
A finished report includes these sections:
An executive summary of what's going well, trouble spots, and goal progress.
Warnings where data might be missing or incomplete.
Detects shifts in focus or activity.
Highlights momentum, plus stalled actions or misaligned KPIs.
Filter by period or team and toggle views.
The AI's answer to your question, and each goal marked on track, at risk, or
off track based on your activity.
In the dialog:
* **Title** — a clear, recognisable name.
* **Questions to include** — toggle prompts like *What is progressing well?*, *Where
are my trouble spots?*, *What's impacting my strategic goals?*, *Are my KPIs tracking
to target?*
* **Custom query** — ask a strategic question, e.g. "What is the one project I should
prioritise above all else?"
* **Teams** — all teams (default) or specific ones.
* **Additional data** (optional) — upload supporting files (financial spreadsheets,
KPI trackers, status updates, meeting transcripts) to enrich the analysis; documents
are deleted once processed.
* **Reporting period** — previous week, month, quarter (the default), or year; current
month, quarter, or year; or a custom date range.
These options shape what the AI analyses, tailoring the report to your questions, data
scope, and audience.
Generation takes a minute or two — you can work elsewhere in the platform while it runs.
## Review the completed report
A finished report includes these sections:
An executive summary of what's going well, trouble spots, and goal progress.
Warnings where data might be missing or incomplete.
Detects shifts in focus or activity.
Highlights momentum, plus stalled actions or misaligned KPIs.
Filter by period or team and toggle views.
The AI's answer to your question, and each goal marked on track, at risk, or
off track based on your activity.
 ## Edit, share, and schedule
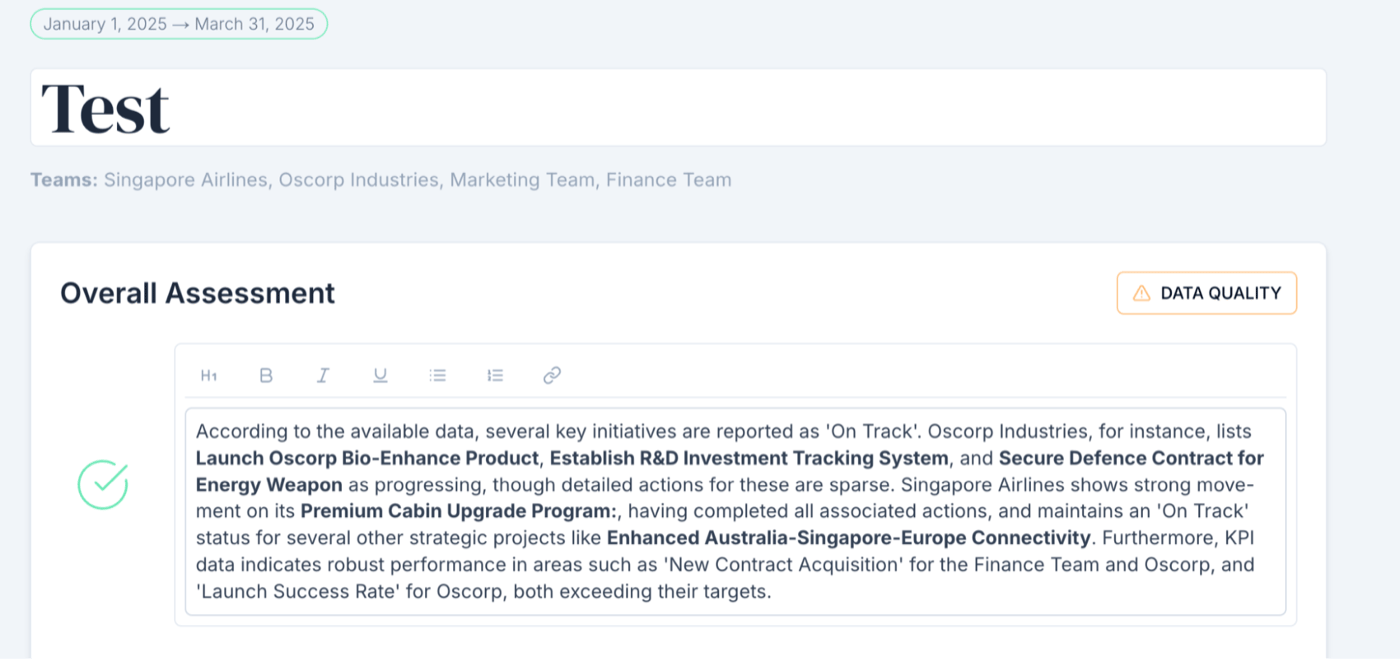
Click **Edit** to refine the AI-generated text — add commentary or correct
anything the AI misunderstood — then save to finalise the version.
## Edit, share, and schedule
Click **Edit** to refine the AI-generated text — add commentary or correct
anything the AI misunderstood — then save to finalise the version.
 Reports are **private by default**. Click **Share** and grant access as
**Viewer** (read-only) or **Editor** (can edit and share), with an optional
personalised email message.
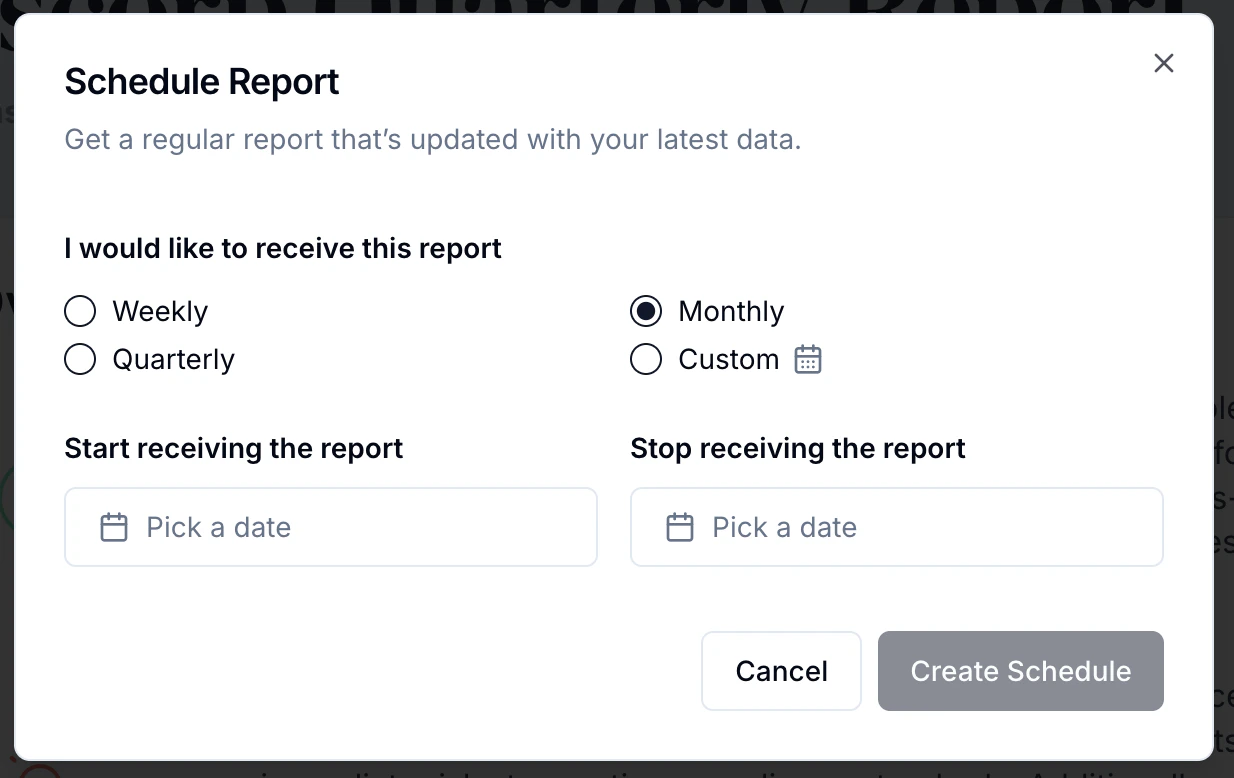
Use **Schedule** (from the report list or inside a report) to set a
frequency and date range. Ciclo regenerates the report on that cadence and
shares it automatically with the same people.
Reports are **private by default**. Click **Share** and grant access as
**Viewer** (read-only) or **Editor** (can edit and share), with an optional
personalised email message.
Use **Schedule** (from the report list or inside a report) to set a
frequency and date range. Ciclo regenerates the report on that cadence and
shares it automatically with the same people.
 Consultant (partner) accounts can enrich a report with a [Deep
Research](/features/deep-research) report for deeper, AI-generated analysis
and external context. For consultants, scheduled reports are a simple way to
keep clients engaged between sessions — see [Demonstrating report
value](/consultants/reports-value).
## Strategy Assessments
Alongside the progress and deep research reports above, the Reports page also lists your teams' **Strategy
Assessments**. A Strategy Assessment is the scorecard generated from the
[Strategy page](/features/strategy): it rates your strategy across four dimensions — are the
key elements present, is it coherent, are goals clear and measurable, and is it actionable? —
each marked *poor*, *average*, *good*, or *excellent*, with positives, areas to improve, and
recommendations.
* **One per team** — each team with a generated assessment appears as its own row, named
*Strategy Assessment — {team}*.
* **View-only here** — open an assessment to read it, but assessments can't be shared,
scheduled, or deleted from the Reports page; those actions apply to progress and deep research reports only.
* **Stale badge** — if a team's strategy has changed since its assessment was generated, the
row is marked **Stale**. Re-run the assessment from the
[Strategy page](/features/strategy) to refresh it.
Visibility follows your team access: organisation administrators see every team's assessment,
while everyone else sees assessments only for the teams they belong to.
## Best practices
* **Ask specific questions** — better input gives better AI answers.
* **Use a regular schedule** — establish a cadence to track momentum.
* **Review data quality** — clean, complete data produces accurate insights.
* **Bring reports into reviews** — use them in quarterly and monthly planning.
## Related
Consultant (partner) accounts can enrich a report with a [Deep
Research](/features/deep-research) report for deeper, AI-generated analysis
and external context. For consultants, scheduled reports are a simple way to
keep clients engaged between sessions — see [Demonstrating report
value](/consultants/reports-value).
## Strategy Assessments
Alongside the progress and deep research reports above, the Reports page also lists your teams' **Strategy
Assessments**. A Strategy Assessment is the scorecard generated from the
[Strategy page](/features/strategy): it rates your strategy across four dimensions — are the
key elements present, is it coherent, are goals clear and measurable, and is it actionable? —
each marked *poor*, *average*, *good*, or *excellent*, with positives, areas to improve, and
recommendations.
* **One per team** — each team with a generated assessment appears as its own row, named
*Strategy Assessment — {team}*.
* **View-only here** — open an assessment to read it, but assessments can't be shared,
scheduled, or deleted from the Reports page; those actions apply to progress and deep research reports only.
* **Stale badge** — if a team's strategy has changed since its assessment was generated, the
row is marked **Stale**. Re-run the assessment from the
[Strategy page](/features/strategy) to refresh it.
Visibility follows your team access: organisation administrators see every team's assessment,
while everyone else sees assessments only for the teams they belong to.
## Best practices
* **Ask specific questions** — better input gives better AI answers.
* **Use a regular schedule** — establish a cadence to track momentum.
* **Review data quality** — clean, complete data produces accurate insights.
* **Bring reports into reviews** — use them in quarterly and monthly planning.
## Related