The Performance page is where you track and manage your team’s KPIs. Each KPI appears as a
tile showing current progress toward its target, with a detailed history a click away.
Well-designed KPIs translate your strategic goals into measurable outcomes — so you always
know whether you’re moving in the right direction.
The Performance page, with each KPI shown as a tile
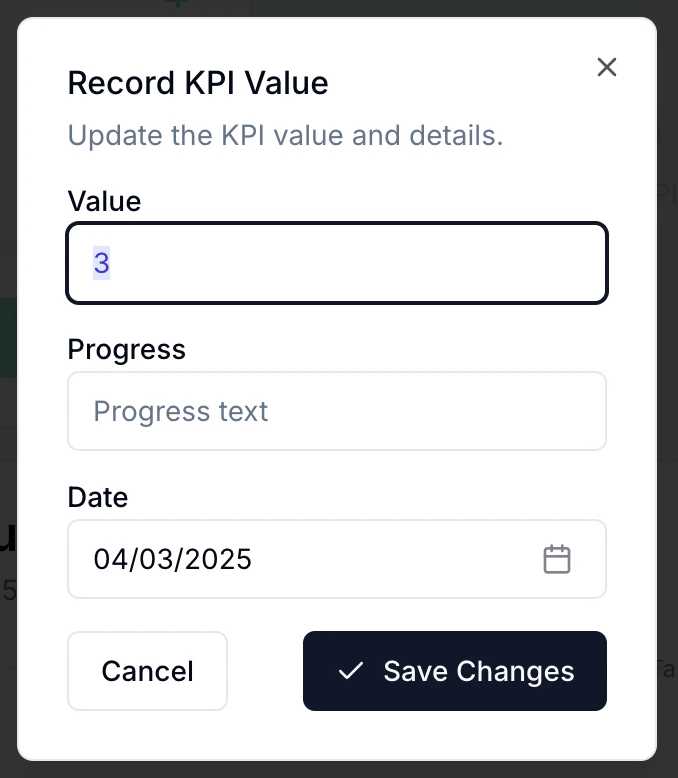
Open the tile’s three-dot menu and choose Record KPI Value. Enter the current
value, an optional comment, and the date it was achieved.
Recording a new KPI value
2
View the detail chart
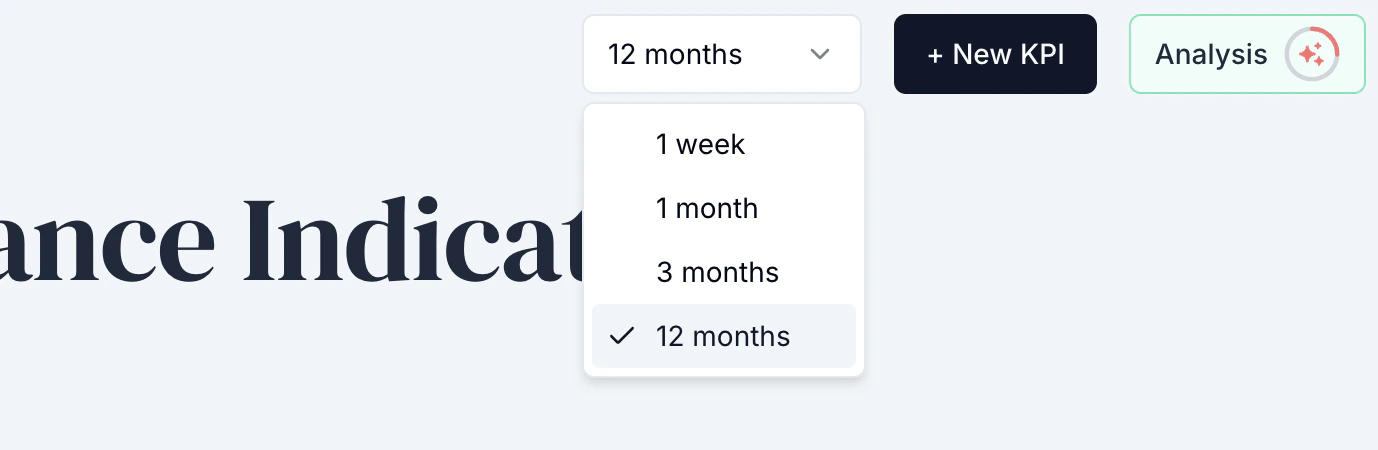
Click Detail on a tile to see how the value has changed over time. Use the time
selector (1, 3, or 12 months) to focus on short-term progress or long-term trends.
The detail chart shows performance over time
Adjust the time range shown
Add a comment whenever you record a value to explain significant changes — your future
self and your team will thank you.
Actions → KPIs — link day-to-day actions to the KPIs they impact for an OKR-style approach.
KPIs from your Performance page appear automatically on the
Strategy page. Use Import to display a KPI from another team for
cross-functional visibility.
Import a KPI from another team for cross-functional visibility